Teams pick the top model on an OCR benchmark leaderboard, then extraction fails on the documents those test sets never covered: multi-column invoices, handwritten consult notes across 800-page charts, logistics manifests with nested tables that span page breaks. Benchmark datasets test clean, typed text with consistent layouts; production workflows process scanned PDFs with skew, rotated headers, mixed handprint and type, and fax compression artifacts. Rankings predict which models win on static test sets, not which systems hold accuracy when layout variability compounds at volume, which is why production-focused benchmarks like RealDoc-Bench measure parsing performance on real documents teams actually process.
TLDR:
- Standard OCR benchmarks test clean documents; models that score near the top on those test sets often see meaningful accuracy drops on multi-page loan packages with handwritten annotations, scanned artifacts, and variable layouts.
- CER and F1 scores measure text accuracy, not layout; a model scoring 98% CER fails field extraction on multi-column tables where positional context determines field identity.
- Benchmark costs exclude deployment reality; top-scoring LLM-based OCR systems carry token costs and latency overhead that make them unviable at 50,000+ pages per month.
- Layout and text extraction are separate failure modes; teams need benchmarks reporting both metrics independently to predict production performance on complex documents.
- Extend's RealDoc-Bench measures parsing on real production documents: 0.847 Adjusted F1 layout accuracy and 95.7% document Q&A accuracy across 1,500+ samples from logistics, healthcare, financial services, and real estate workflows.
What OCR Benchmarks Actually Measure
OCR benchmark leaderboards typically score models on curated test sets with clean, predictable layouts. Those scores are real; they measure a narrow slice of what production document workflows require.
The two primary metrics, CER and F1, each miss something in production. CER measures incorrectly recognized characters relative to ground truth. A 2% CER sounds acceptable until that 2% lands on a policy number, a dollar amount, or a medication dosage. The error rate is uniform in calculation; the damage is concentrated in high-stakes fields. F1 balances precision and recall across extracted tokens, making it a better signal for structured extraction. A system that recovers most fields but misses low-frequency ones scores well on F1 while failing on exactly the documents that require the most accuracy.
Neither metric captures layout. A model can achieve 98% CER on a curated test set while completely misreading table structure, treating merged cells as independent rows or collapsing multi-column layouts into a single text stream. Downstream extraction then receives clean characters in the wrong semantic context, producing confident-looking output with wrong field assignments.
Academic datasets compound the gap. A "financial document" test set includes a clean bank statement; your team's pipeline handles 200-page mortgage packages with mixed handwriting, stamps, variable DPI scans, and nested tables spanning page breaks. Three structural mismatches drive most of the performance difference:
- Layout variability: Most benchmark documents use a single, stable layout. Real vendor invoices arrive in dozens of formats from the same supplier across a 12-month period.
- Noise and degradation: Scanned documents with skew, low resolution, or fax compression degrade OCR accuracy sharply. Benchmarks built on born-digital PDFs don't surface this failure mode.
- Multi-page context: Benchmarks score per-page or per-field in isolation. Production documents require resolving references across page boundaries, which per-page scoring metrics structurally cannot measure.
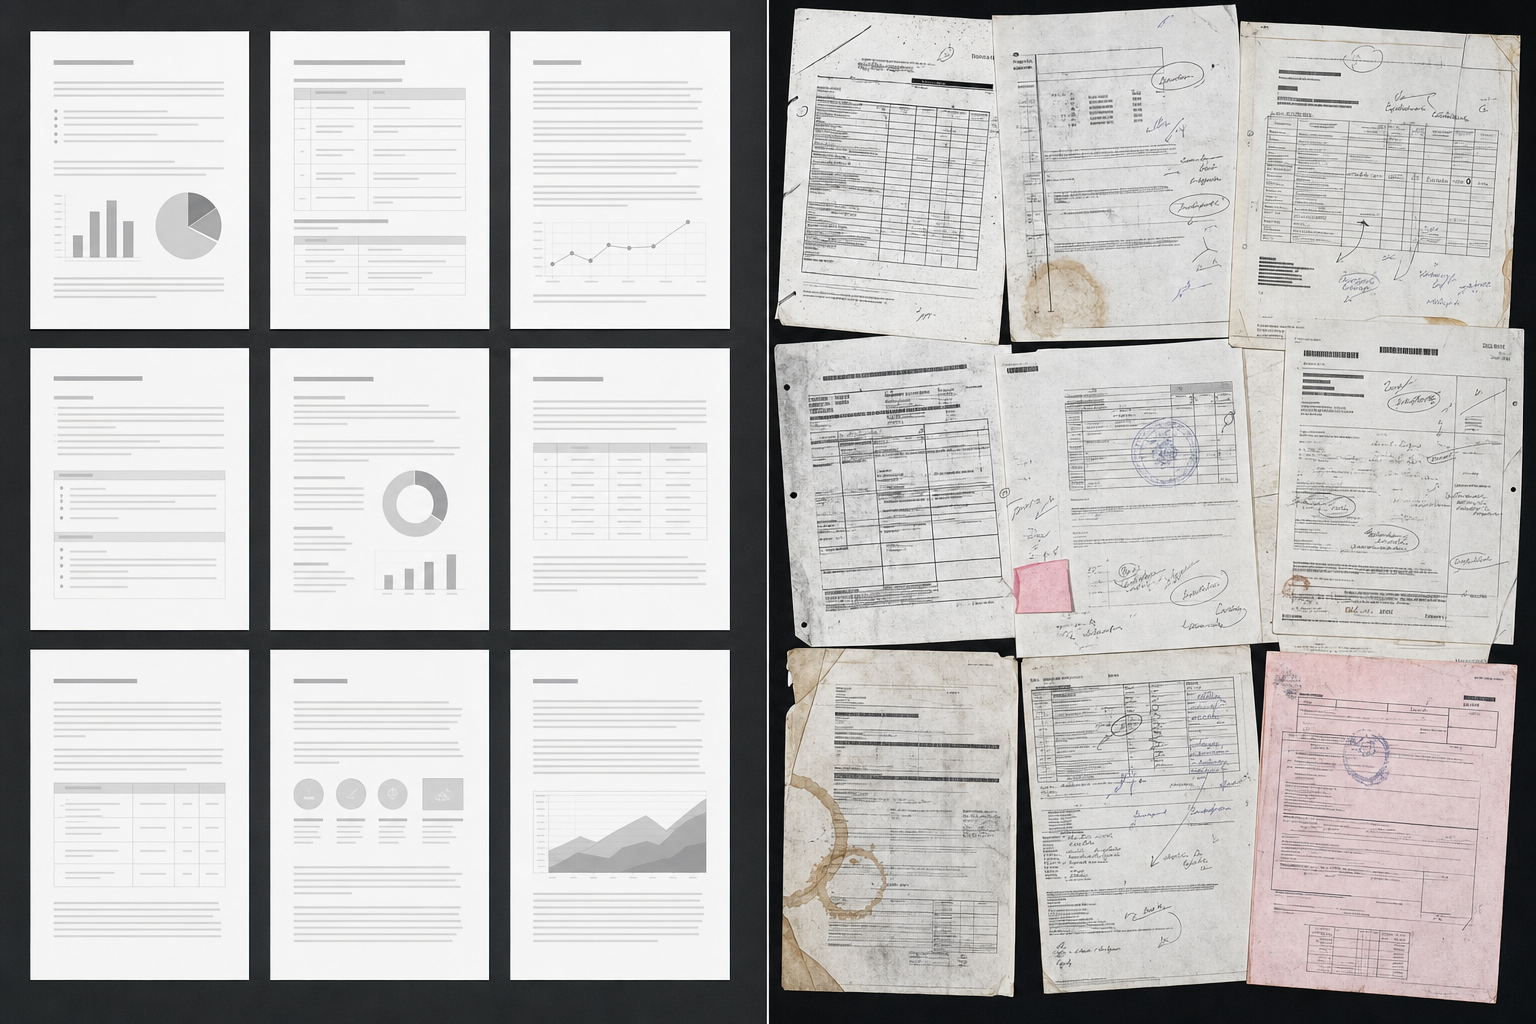
The Five Document Characteristics That Break Standard OCR Benchmarks
| Document Characteristic | Standard Benchmark Test Conditions | Production Document Reality |
|---|---|---|
| Layout Complexity | Single-column documents with consistent spacing and standard fonts on white backgrounds | Multi-column tables with nested structures, merged cells, rotated headers, and footnotes that span page breaks |
| Handwriting and Mixed Content | Printed text only, measured on clean typed regions with uniform character recognition | Handwritten annotations layered over printed text, form fields mixed with stamps, and signature blocks across same-page content |
| Document Length | Test sets capped at one to four pages with single-page evaluation tasks | 200+ page mortgage packages, insurance submissions, and medical records requiring cross-page entity resolution |
| Scan Quality | Born-digital PDFs with clean output, no compression artifacts or resolution degradation | Scanned documents with skew, low DPI, fax compression artifacts, partial occlusion, and variable quality across pages |
| Domain Formatting | Generic documents from web or academic sources with horizontal structure patterns | Vertical-specific formatting conventions in financial statements, logistics documents, and healthcare records that generic datasets miss entirely |
Benchmark scores break when the test set stops matching production reality. Five document characteristics separate controlled evaluation conditions from what actually arrives in processing pipelines.
Layout Detection vs. Text Extraction: Why Both Metrics Matter
Most OCR benchmarks report a single accuracy score, which collapses two structurally distinct problems into one number: whether the system read the text correctly, and whether it understood where that text lives on the page.
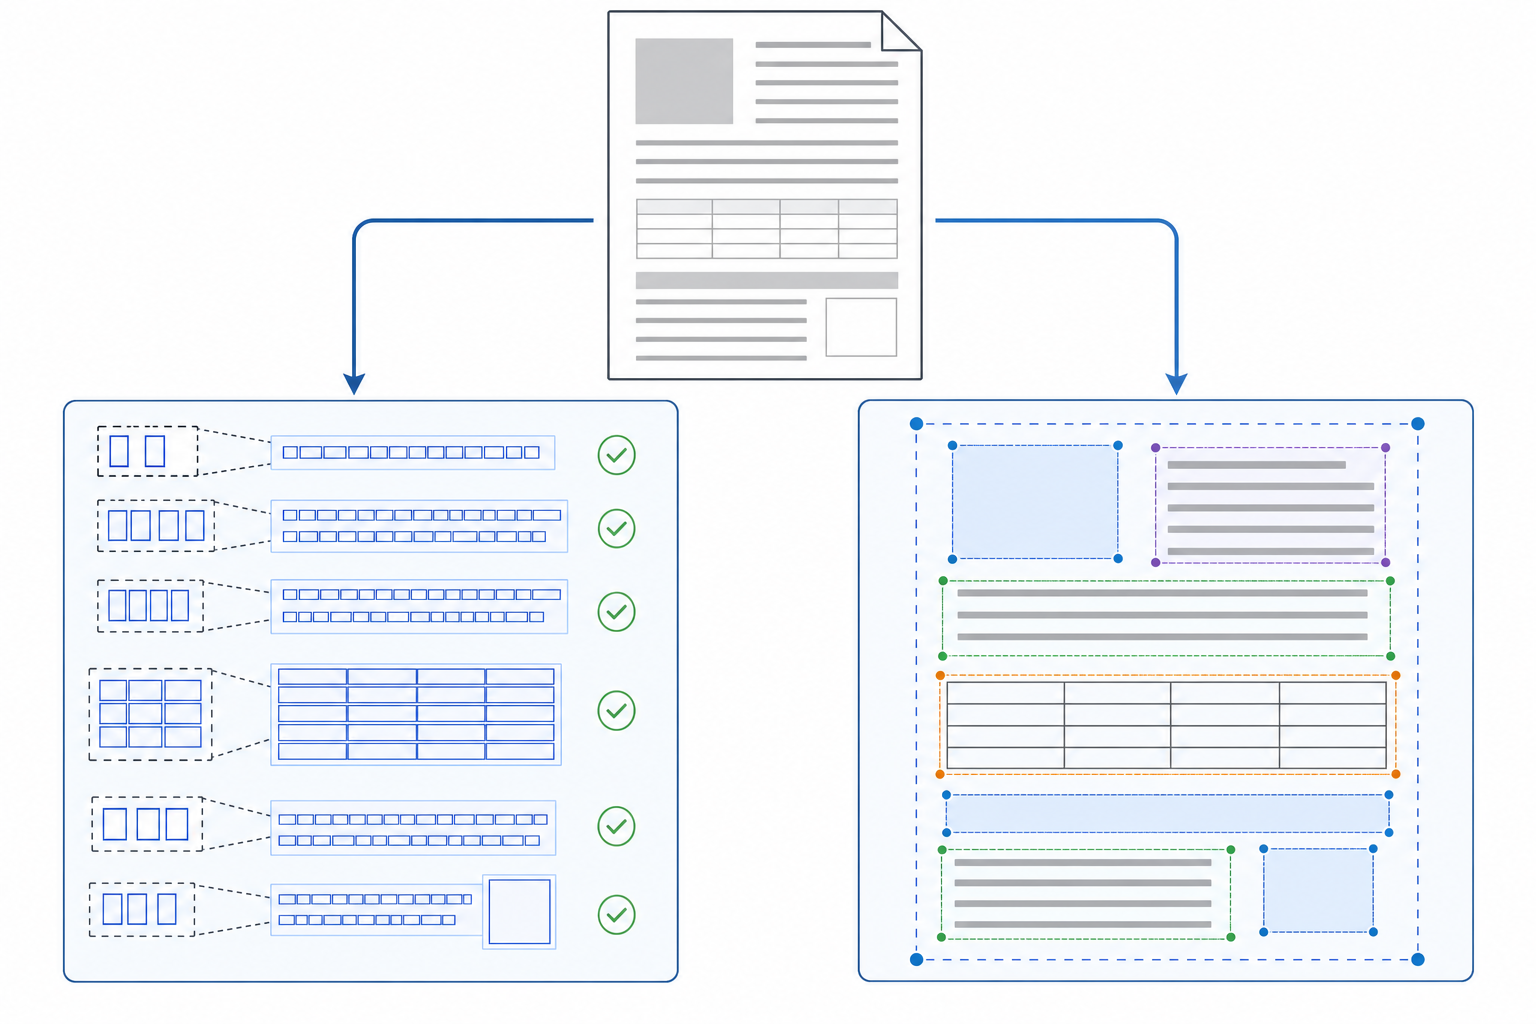
These are separate failure modes. Character accuracy and structural accuracy move independently: a parser transcribes every character correctly yet still assigns those characters to the wrong row, column, or field region. The result is clean text mapped to the wrong field, which a composite accuracy score cannot surface.
Layout detection governs whether a system correctly identifies regions: tables, headers, footnotes, and form fields. Text extraction governs whether characters within those regions are transcribed accurately. On complex documents like insurance policies, loan packages, or medical records, layout errors propagate across every field that depends on positional context. A system scoring 95% on text extraction but 70% on layout detection fails on any document where field identity depends on position over content alone.
Benchmark Performance vs. Deployment Reality: The Cost and Latency Gap
Benchmark scores reflect accuracy under controlled conditions. Production deployments introduce cost and latency variables that leaderboard rankings never capture. LLM-based OCR systems that rank well on OCR-Bench v2 often process each page through a full multimodal inference pass, generating thousands of tokens per request. At 50,000 pages per month, token costs from a frontier VLM exceed infrastructure budgets that simpler pipeline architectures handle without issue. Latency follows the same pattern: benchmark evaluations measure accuracy on static datasets, not p95 latency under concurrent load, so teams running real-time workflows hit throughput ceilings that leaderboard scores give no warning about.
A model ranking second or third on accuracy may process documents at one-fifth the cost and twice the speed of the top scorer, making it the correct production choice for high-volume pipelines where sub-percentage accuracy gaps matter less than cost per document. Teams selecting OCR systems should track cost per 1,000 pages, median and p95 latency under target concurrency, and accuracy on production document types alongside any public leaderboard position.
Industry-Specific Benchmarks: Healthcare, Financial Services, and Logistics
Generic OCR benchmarks test clean, standardized documents. Real enterprise workflows don't look like that. Healthcare charts run 800+ pages with handwritten notes across structured lab tables. Financial packages mix term sheets with handwritten amendments where table structure accuracy matters more than raw character recognition. Logistics documents combine machine-printed fields with freehand cargo descriptions that break on multi-line entries. Each vertical surfaces failure modes that horizontal benchmarks won't catch. Treat leaderboard scores as directional signals only, then run targeted tests against production samples before committing to an extraction architecture.
How Extend Validates Parsing Quality on Complex Production Documents
RealDoc-Bench is Extend's purpose-built benchmark for measuring parsing performance on the documents that actually show up in production pipelines: multi-column insurance forms, handwritten annotations layered over typed text, dense financial tables, and logistics packets with inconsistent layout across pages.
The benchmark covers two measurement tracks. Layout accuracy runs across 1,500 samples drawn from logistics, healthcare, financial services, and real estate documents, scoring how accurately a parser reconstructs the structural representation of a page. Document Q&A accuracy runs across 1,359 prompts and 581 documents, measuring whether downstream reasoning on parsed output produces correct answers.
Parse 2.0, Extend's next-generation parsing engine, leads on both tracks: 0.847 Adjusted F1 on layout accuracy and 95.7% on document Q&A output accuracy.
The datasets are published openly. Teams testing parsers against real production document types can access the layout dataset and the document Q&A dataset on Hugging Face at Extend-AI/RealDoc-Bench-Layout and Extend-AI/RealDoc-Bench, and the full benchmark methodology is documented in the RealDoc-Bench repository.
Final Thoughts on What OCR Benchmarks Actually Predict
OCR benchmark leaderboards rank models on curated datasets that favor clean layouts and predictable structures. Production workflows break on the documents those benchmarks leave out: multi-page loan packages, handwritten annotations, rotated scans, and tables that span page breaks. The systems that score highest on generic test sets often carry cost and latency tradeoffs that only show up at volume. Your extraction architecture needs validation on the specific document types your team processes, not on datasets optimized for benchmark coverage. Test Parse 2.0 on production documents that match your workflows.
FAQ
What's the difference between OCR benchmark leaderboards and production document accuracy?
OCR benchmark leaderboards like OCRBench v2 measure character-level accuracy on curated test sets with clean, predictable layouts, while production accuracy reflects performance on variable vendor formats, handwritten annotations, multi-column tables, and scanned documents with compression artifacts. A model that scores near the top on benchmark datasets can see meaningful accuracy drops on real loan packages, insurance submissions, or logistics manifests because benchmark test sets exclude the layout variability, scan quality degradation, and multi-page context dependencies that production pipelines process daily.
OCR benchmark dataset vs real-world document complexity?
Academic OCR benchmark datasets optimize for coverage of document categories, not difficulty within them. Benchmark financial documents typically include clean bank statements with standard fonts and single-column layouts, while production financial workflows handle 200+ page mortgage packages with mixed handwriting, stamps, variable DPI scans, and nested tables that span page breaks. The structural mismatch means benchmark scores predict little about extraction behavior on documents with the five characteristics that break standard evaluation: layout complexity, handwritten content, cross-page references, scan quality variation, and domain-specific formatting conventions.
Why do layout detection scores matter more than text extraction scores?
Layout detection determines whether a system correctly identifies regions like tables, headers, and form fields, while text extraction measures character-level transcription accuracy. A system can achieve 95% text extraction accuracy while completely misreading table structure, treating merged cells as independent rows or collapsing multi-column layouts into single text streams, which produces clean characters in wrong semantic context and triggers downstream field assignment failures. On insurance policies, loan packages, or medical records where field identity depends on position over content alone, layout errors propagate across every extraction that relies on structural understanding.
How do benchmark economics break down at production volume?
Benchmark scores measure accuracy on static datasets without capturing per-page token costs or p95 latency under concurrent load. LLM-based OCR systems ranking well on OCR benchmark leaderboards often process each page through full multimodal inference passes, generating thousands of tokens per request. At 50,000 pages per month, token costs from frontier VLMs exceed infrastructure budgets that simpler pipeline architectures handle without issue. Teams running real-time document workflows hit throughput ceilings that leaderboard rankings give no warning about, where a model ranking second on accuracy may process documents at one-fifth the cost and twice the speed of the top scorer.
LLM OCR benchmark performance vs RealDoc-Bench results?
RealDoc-Bench measures parsing performance on production documents teams actually process: multi-column insurance forms, handwritten annotations over typed text, dense financial tables, and logistics packets with inconsistent layouts. The benchmark reports layout accuracy (0.847 Adjusted F1 across 1,500 samples from logistics, healthcare, financial services, and real estate) and document Q&A output accuracy (95.7% across 1,359 prompts and 581 documents) separately, exposing tradeoffs that composite OCR benchmark scores hide. Parse 2.0 leads on both tracks, validated against real-world document complexity instead of academic test sets.